
The visit of Chinese President Xi Jinping to the U.S. has prompted lots of definitive articles explaining China. We here at Wonkblog put together a voluminous one of our own.
But maybe you prefer not to read so many words, and just look at pictures instead. If that's the case, here are 30 charts and maps that will explain China today.
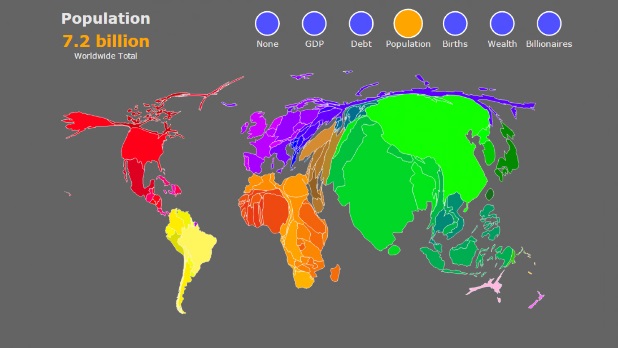
China's population is really, incredibly huge.
The map below by Max Galka of Metrocosm helps to demonstrate that. The land area of each country is sized to be proportionate that country's share of the global population. China and India are massively bloated, while the U.S. has gone on a diet. In fact, many Chinese provinces have populations equivalent to Germany, the Philippines or Thailand.
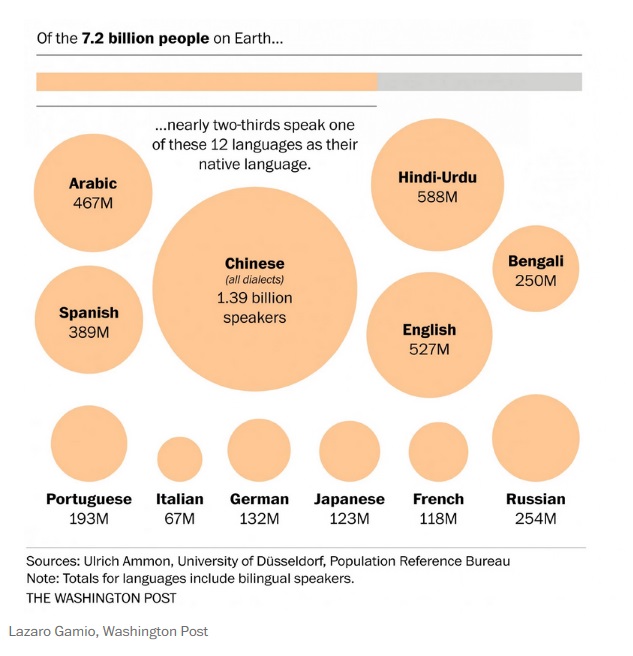
The Chinese language has more native speakers than any other language.
The chart below, by Rick Noack and Lazaro Gamio of The Washington Post, shows the global population broken down by language. Again, you can see China's dominance. Chinese (including all dialects, which in some cases could be considered separate languages -- see below) has significantly more native speakers than Hindi-Urdu, English, Arabic or Spanish.
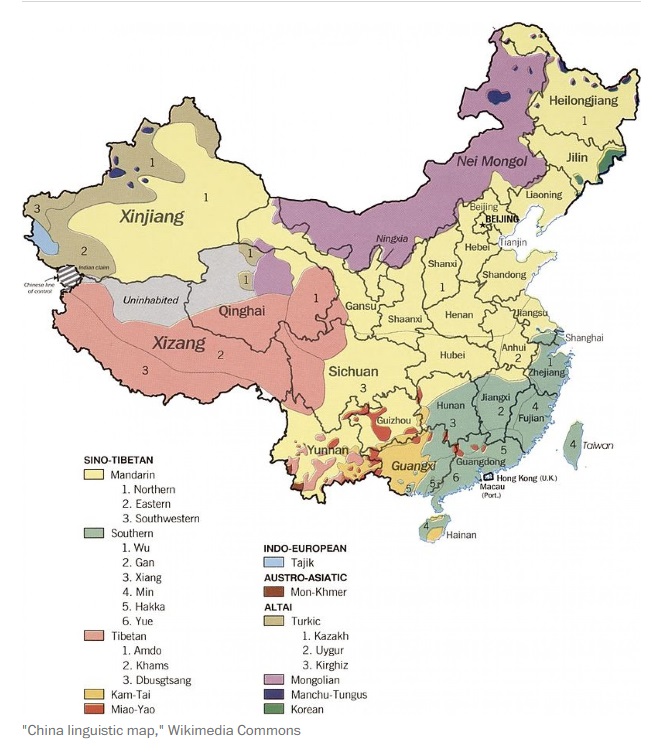
China is more diverse than you might think.
One thing people outside of China may miss is the country's incredible diversity. A lot of Chinese are of the same ethnic group, Han, and almost everyone learns the national language, Mandarin, in school. But many people in different parts of China grow up speaking languages that are mutually unintelligible -- as different or more different from each other than European languages.
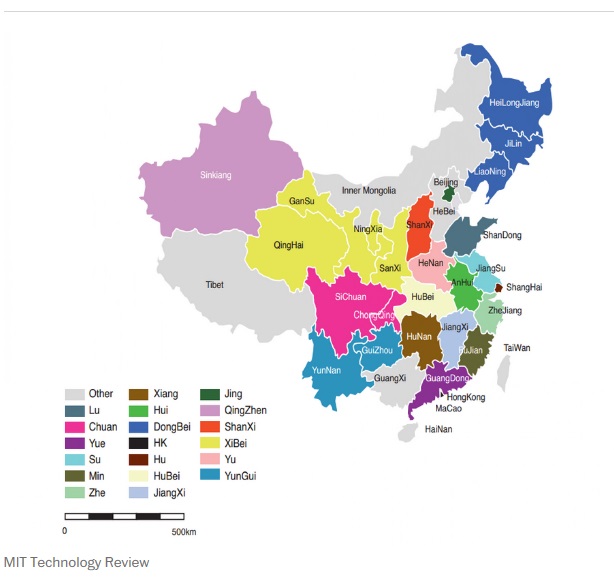
The food is diverse, too!
Most Chinese restaurants market themselves in the U.S. as "Beijing" or "Szechuan/Sichuan." But those are only two of China's many yummy cuisines. In the map below, researchers at MIT used computer programs to analyze a database of recipes. They mapped the divisions below based on differences in their ingredients.
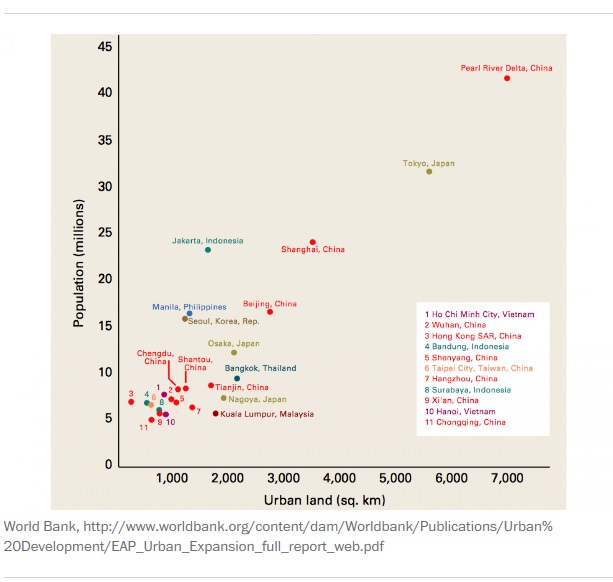
China contains what could be called the world's biggest city.
Since you know how big China is, you might not be surprised at the colossal size of its cities. This graphic from the World Bank charts global cities in terms of their population and land size.
The report classifies the Pearl River Delta, an area of southern China across from Hong Kong, as a city, since it argues that all the urban centers in the region run continuously together. Counted this way, the Pearl River Delta is the world's biggest city, bigger than Tokyo. Shanghai is third.
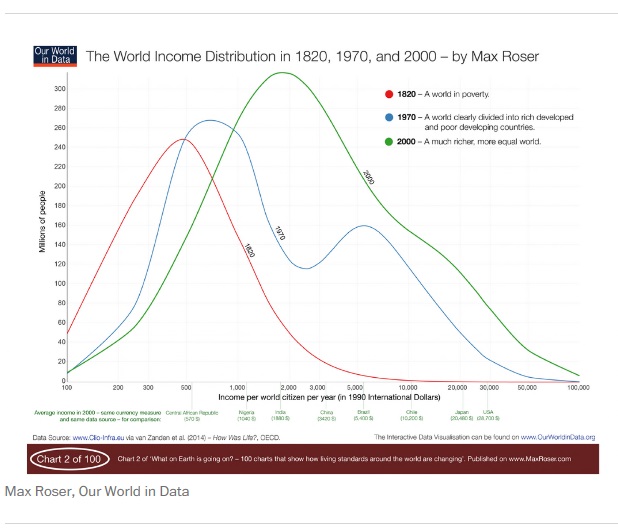
China's growth has made the world a more equal place.
China's development over the last few decades has lifted 500 million people out of poverty; it is basically the reason the UN has accomplished so many of the Millennium Development Goals set in 2000.
The chart below, by Max Roser of Our World in Data, shows that China's growth has had a big influence on the way wealth is distributed around the world.
The vertical axis shows the number of people in millions, while the horizontal axis shows earnings per person per year. The red line represents how the world's income was distributed in 1820. So, looking at where the red line peaks, in 1820 roughly 250 million people were earning $500 per year.
The blue line shows the income distribution in 1970. You can see that the world has gotten richer and more populous, but that the world is clearly divided into rich developed and poor developing countries. By 2000, however, the line has moved up and out -- showing a richer, more equal world.
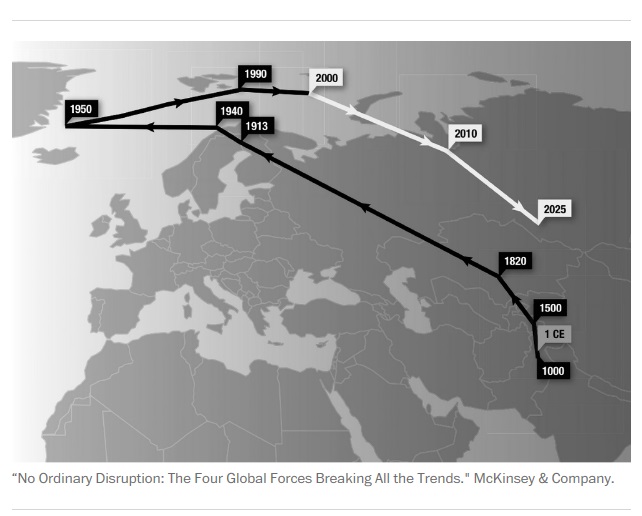
It has shifted the world's "economic center of gravity"
The map below, by the McKinsey Global Institute, shows something called the Earth's world's “economic center of gravity.” It's a little complicated, but the researchers basically weighted each country by an estimate of its GDP, and then used those weights to calculate the approximate economic center of mass of the world.
As the map shows, that center has moved over time. In 1,000 AD, China and India accounted for two-thirds of global economic activity, and the global economic center was firmly in the Middle East. It remained there for roughly 1,500 years before shifting to Europe with the advent of the Industrial Revolution, and then toward North America.
But East Asia’s stunning economic rise and urbanization in the last few decades, along with the growth of India and other emerging economies, has rapidly tugged the center back toward its origin. By 2025, the world’s economic center will be as far east as it was in 1,000 AD, though substantially farther north.
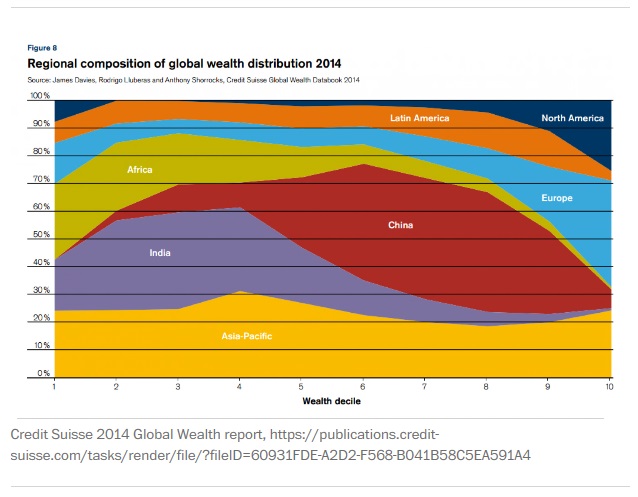
The Chinese are now basically the global middle class.
We don't usually think of the world having a middle class, but the Chinese are good candidates. The Chinese earn more than India, Africa and much of the Asia-Pacific but less than Europe and the U.S., as the graph below shows. The chart, from Credit Suisse's 2014 Global Wealth report, shows global wealth broken down by decile, or every 10 percent of the world wealth distribution.
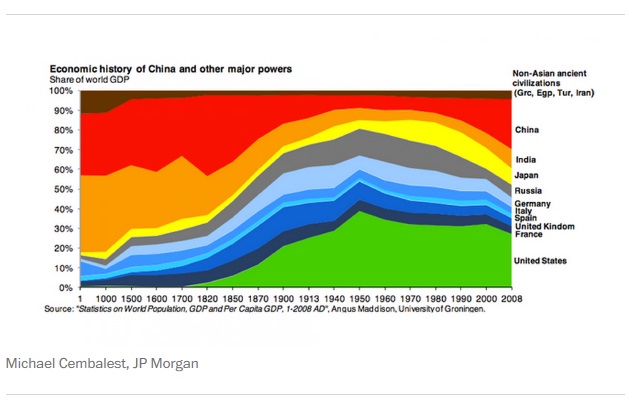
China's economic rise is a return to a historical norm.
Americans tend to think of China’s rise as happening in the past few decades, but many Chinese have a longer memory. For most of the last 2,000 years, China was one of the world's biggest economies. China has one of the world’s oldest civilizations. To those with a long view of history, China's position as a relatively poor country in the early 20th century is the aberration, following thousands of years when the country was without question one of the world's great powers. The chart below shows just how dominant China's economy has been for the last 2,000 years:
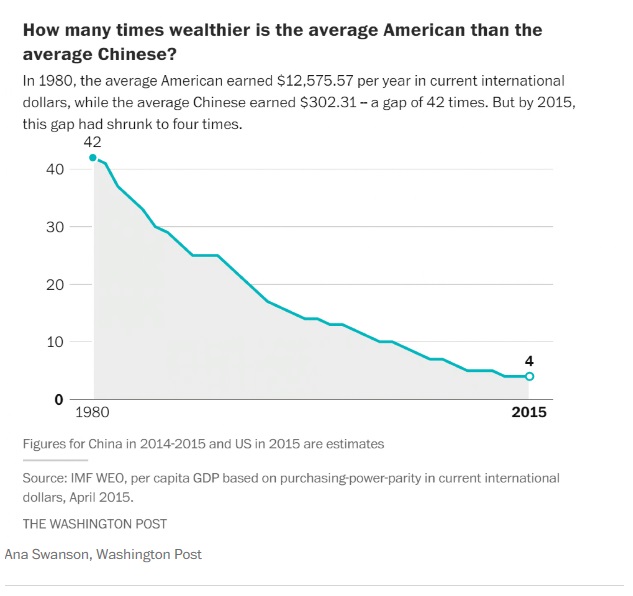
Chinese have gotten a lot richer -- but they're still not nearly as wealthy as Americans.
China's economy has developed a lot since 1980, as leaders loosened restrictions on private business and opened the country to the outside world. That has led to an incredible growth in Chinese incomes. Since 1980, the average Chinese person's income has increased more than 45-fold. Back in 2000, an average American was earning 13 times as much as the average Chinese; in 1980, the difference was 42 times.
That's incredible growth, but the Chinese are still far from catching up with Americans. As the chart below shows, the average American earned more than four times as much as the average Chinese person did in 2013, making $53,000 vs. $11,885. (This is on a purchasing power parity basis, which actually makes those in poorer countries seem relatively richer, since it accounts for the cheaper cost of many goods and services in poorer countries.)
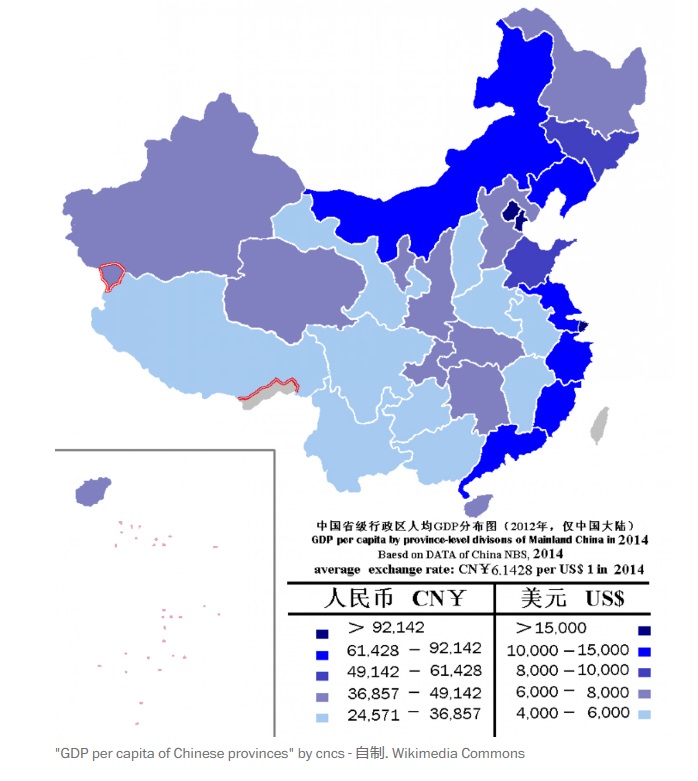
China's wealth isn't spread around evenly.
China is now one of the world’s more unequal countries. Much of the wealth – and the country’s new crop of millionaires – is concentrated on the eastern coast, while in China’s interior hundreds of millions of people are still basically subsistence farmers.
The map below shows how that wealth is concentrated. The darker blue areas along the coast are the cities of Beijing and Tianjin in the north, and the city of Shanghai in the middle, where average incomes are more than three times as much as the interior.
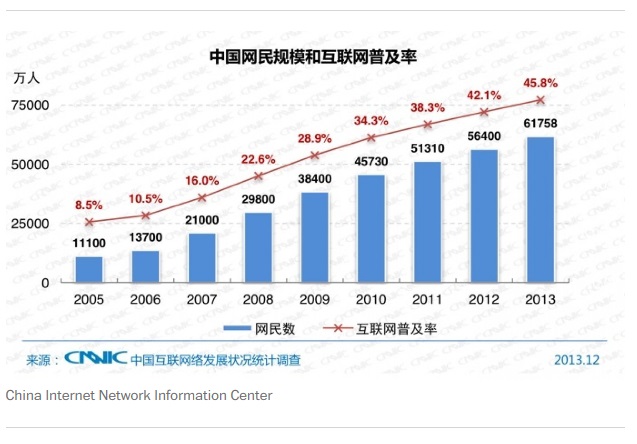
China has nearly twice as many Internet users as the U.S. has people.
China is more connected than you might think. According to the China Internet Network Information Center, the country has nearly 618 million Internet users -- nearly twice as many people online in China as there are people in the United States. Five hundred million of those users in China are mobile Web users.
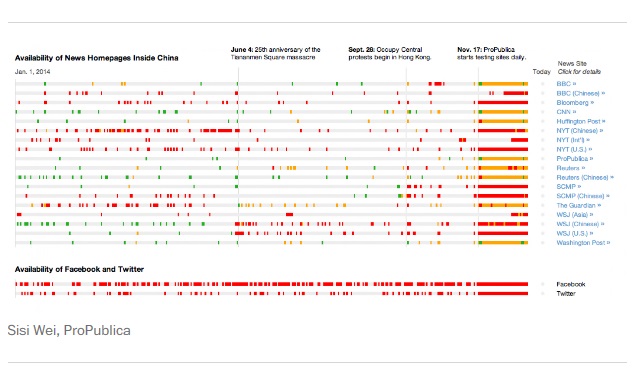
Most foreign news sites are blocked in China.
China heavily censors its domestic Internet through the use of technology dubbed “The Great Firewall.” Yet the country’s censorship of certain individual sites can vary greatly with the news cycle. The graphic below, created by Sisi Wei for ProPublica, shows that censorship has become more extensive since pro-democracy protests began in Hong Kong last September.
Many of the tests were inconclusive (shown in yellow), meaning that some but not all of the servers tested showed signs of blocking. That could mean that some regions of China are blocking the site, or that Internet service providers are having technical difficulties.
However, many sites show signs of increased censorship. ProPublica found evidence of censorship on sites that were not often blocked before the protests, including Reuters and the BBC. The homepages of BBC’s Chinese service, Bloomberg, the New York Times, and the Wall Street Journal were completely blocked, as were Facebook and Twitter.
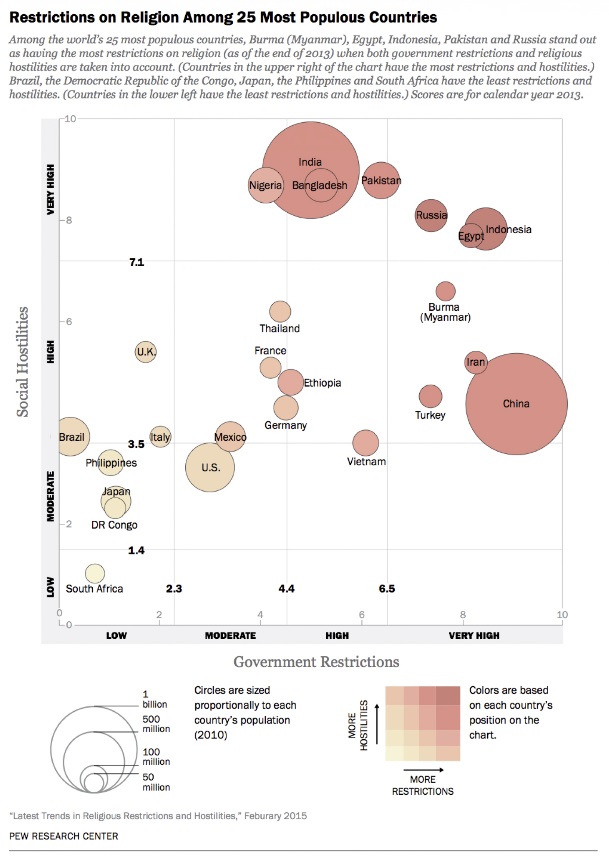
The Chinese government maintains among the world's tightest restrictions on religion.
As this graph by Pew Research Center shows, China has among the toughest restrictions on religion, defined as laws, policies and actions that restrict religious beliefs and practices. It is toward the extreme right-hand side of the graph, along with Indonesia, Iran and Egypt.
The chart also shows religious hostilities among private individuals on the vertical axis, a category that Pew says ranges from vandalism of religious property to violent assaults. Here, China doesn't rank so highly. Countries toward the top of the graph, like India, Nigeria, Bangladesh and Pakistan, have the most intense religious hostilities among private individuals
Roughly a quarter of the world’s countries face high levels of religious hostilities, while the same proportion has heavy religious restrictions, says Pew.
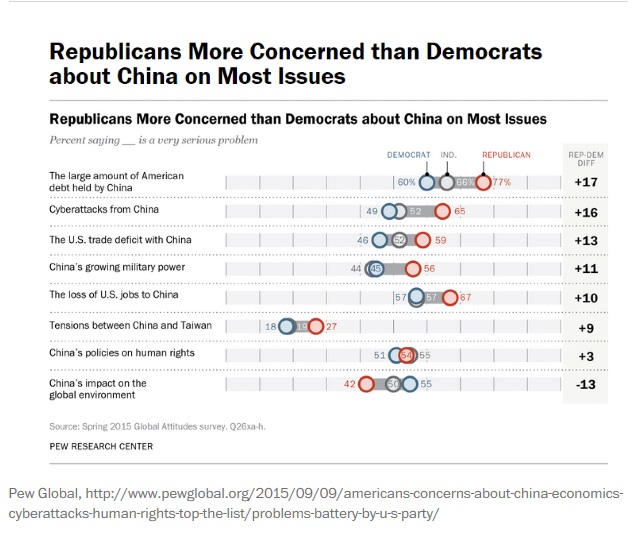
Some Americans are more worried about China than others.
Recent polls show Americans are very worried about Chinese cyberattacks, its growing military power, and the amount of American debt it holds — though actually, the Fed holds a lot more U.S. debt than China and Japan do. Concern about China varies a lot by political party, with Republicans far more concerned than Democrats are, as the poll below by Pew Global shows.
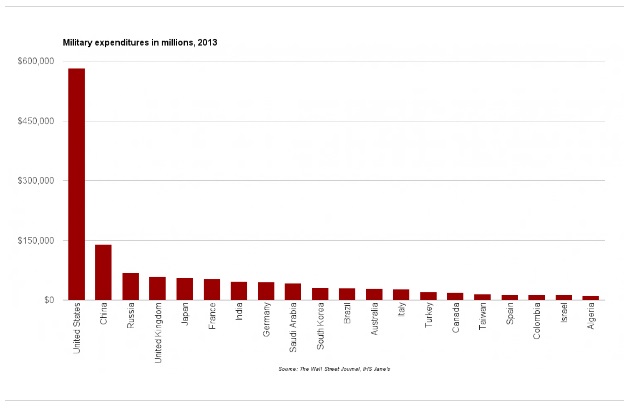
China's military is growing -- but the U.S. still spends way more.
The chart below, adapted from The Wall Street Journal, shows various national military budgets in 2013, when the Pentagon and other U.S. security agencies spent about $582 billion. Despite the forced reductions to our military’s budget, that was still an extraordinary amount of money compared to the smaller sums allocated by other countries around the world — more than China, Russia, the United Kingdom, Japan, France, India, Germany, Saudi Arabia, South Korea, and Brazil spent collectively. (That said, some of these countries are U.S. allies and would be forced to spend more without the protection of the U.S. military.)
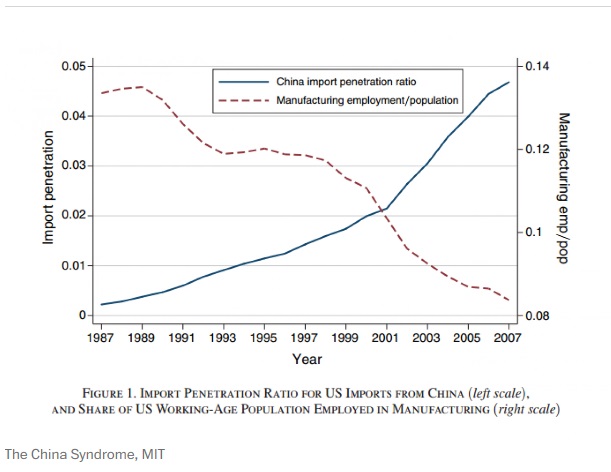
China has led to a loss in U.S. manufacturing jobs.
China's economic rise, and its entry into the World Trade Organization, has coincided with a loss in U.S. manufacturing jobs. The share of Americans working in manufacturing fell from more than 13 percent in the late 1980s to 8.4 percent in 2007, as trade with China increased and its imports into the U.S. soared, as this graph from researchers at MIT shows.
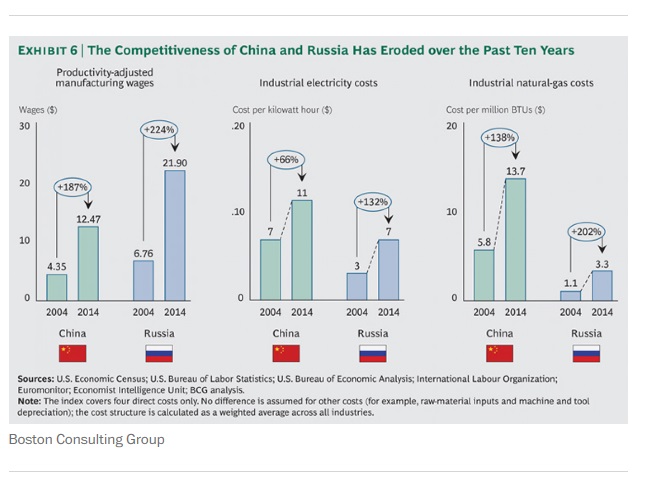
But China's cost advantage in manufacturing is disappearing fast.
As China's economy has developed, wages have risen, and so have the costs of land, energy and other raw materials. That means it is increasingly expensive to manufacture goods in China. Most of these jobs won't come back to the U.S. (though a few are) -- most will go to lower-cost countries like Vietnam, Bangladesh and Mexico.
The chart below, from Boston Consulting Group, shows how the competitiveness of manufacturing in China and Russia has changed over the past 10 years. Even when adjusted for productivity, Chinese manufacturing wages have risen by 187 percent over the decade. Industrial electricity costs have grown 66 percent, while natural gas costs are up 138 percent. In the same time frame, U.S. wages have risen only 27 percent, while natural gas costs have fallen 25 percent, according to Boston Consulting.
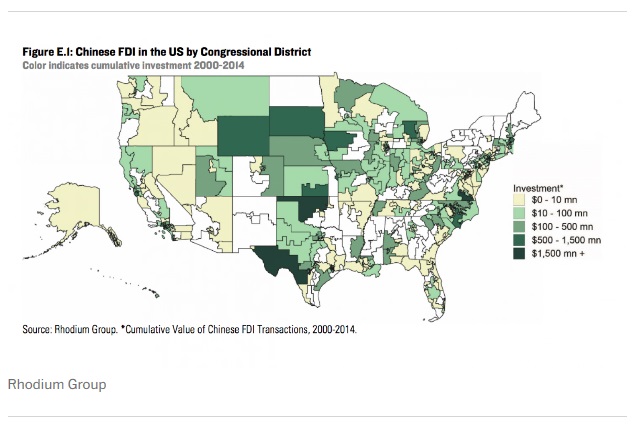
China is investing more in the U.S.
Between the 1980s and 2000s, the U.S. pumped a huge amount of foreign direct investment into China, but that investment moved largely in one direction. It wasn't until recent years that China began returning the favor, as its economy became more developed and its companies began going abroad in search of new products, markets and talented employees.
According to a report by Rhodium Group, an advisory firm, and the National Committee on U.S.-China Relations, a nonprofit, Chinese companies spent nearly $46 billion on acquisitions in the U.S. between 2000 and 2014, with most of that activity happening in the last five years. As the map below of Chinese commercial investment in the U.S. at the Congressional district level shows, investment between 2000 and 2014 varies a lot by location, likely due to the variety of local investment targets and the district's success at recruiting Chinese investors.
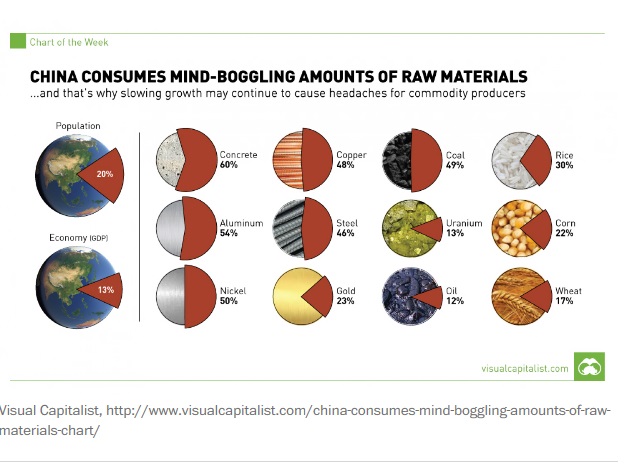
China is gobbling up global resources at an incredible pace.
China is reshaping the world is through its voracious appetite for resources, to feed its factories and build new roads and cities. China accounts for about half of the aluminum, copper, nickel, steel and concrete used worldwide each year, making it a major customer for resource-rich countries like Australia and Brazil.
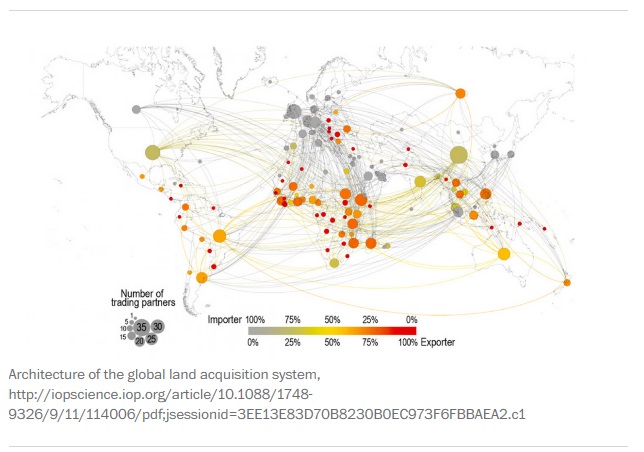
China is grabbing up land around the world -- but so is the U.S.
Researchers at Lund University in Sweden found that most of the world’s countries had bought or sold land internationally as of 2012 – 126 of the 195 countries recognized by the UN, according to their report. But the trade is dominated by just a few players, namely China, the U.K. and the U.S.
The map below shows where governments and agribusinesses are buying and leasing land in foreign countries. Countries that are more engaged in buying land internationally are shown in grey or shades of yellow, while countries that sell more land are shown in red. The bigger the circle, the more trading partners a country has.
China ranks as the most active country in the world in land trade, purchasing land from 33 countries and but selling it to only three. The U.S. is a close second, buying land from 28 countries and selling to three, following by the U.K., which bought land from 30 countries.
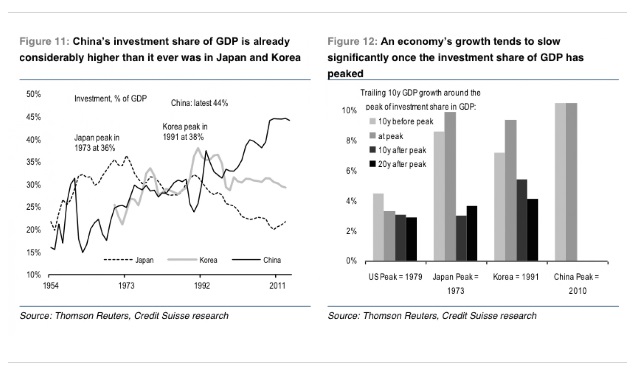
But China's economy appears to have a problem -- it relies too much on investment.
Economists look at growth in terms of three main drivers: A country's exports, its consumption (all the goods and services that normal people and the government buy), and investment, which includes money spent on factories and houses. When you compare what these three drivers look like in China versus other countries in the world, China's economy starts to look very unusual.
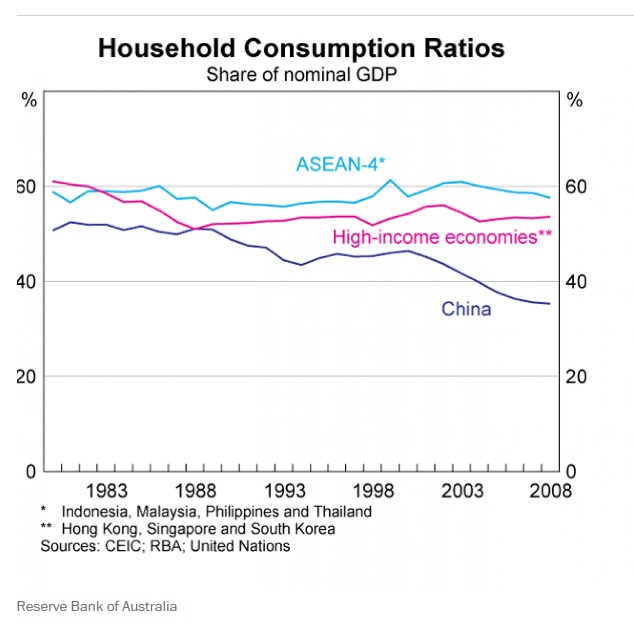
More of China's GDP comes from investment than in any other country in modern history -- even countries that rapidly industrialized as China is doing, like Japan and Korea, as the chart below from Credit Suisse shows. And as a result, a much lower proportion of growth comes from consumption in China than it does in other countries, as the next chart shows.
Some economists argue that this is okay, but many others see it is a worrying sign. They believe that China is pumping too much money into investment, and that that practice is creating a property bubble and excess capacity in factories.
This is why many are urging China to "rebalance" -- to shift its economic model to rely more on consumption and less on investment. China has a slew of policies that incentivize investment, including cheap financing and resource prices, and these would have to be unwound in order to rebalance.
That is leading to a worrying amount of debt.
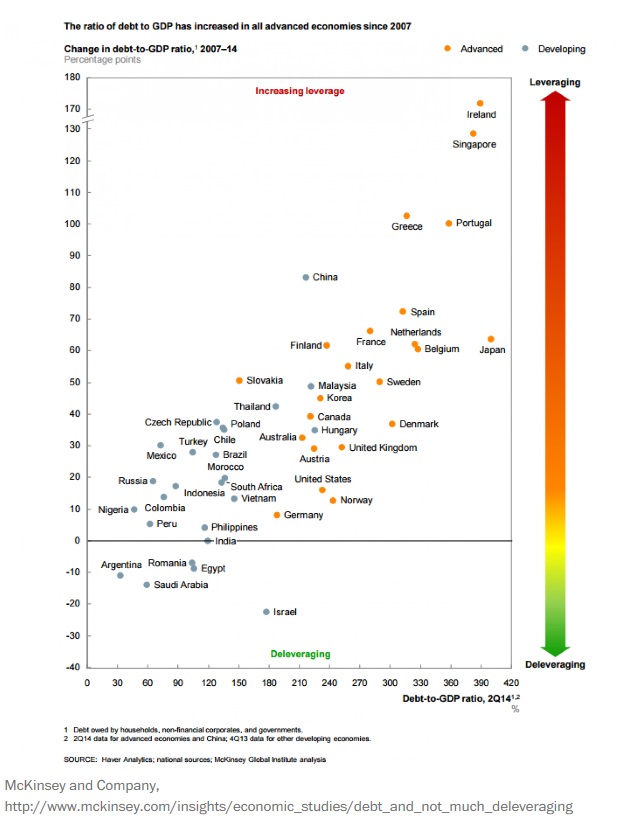
China's huge investments in recent years have caused the debt owned by the government, banks, corporations and households to balloon to 282 percent the size of the economy. That's a far higher debt burden than most developing countries, as well as Australia, the U.S., Germany or Canada, as the graph below from McKinsey & Company shows. Some of these loans will probably never be paid back.
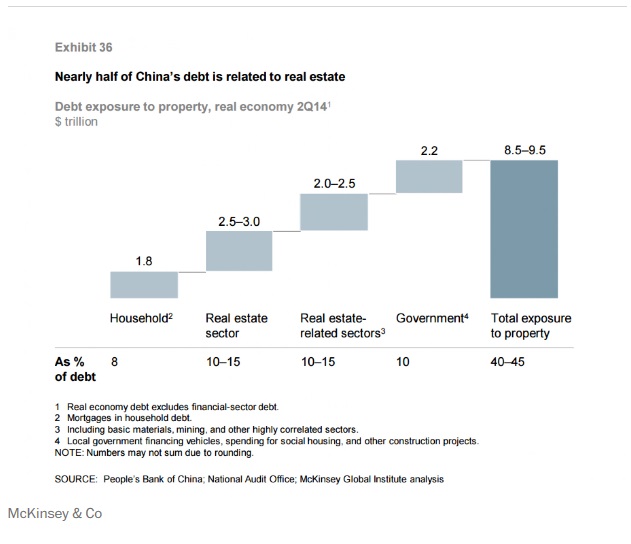
Nearly half of that debt is tied up in the property market.
Property development has been a huge generator of wealth for the country in recent years, and it is now also a massive repository for its debt. Repeated wins in the property market encouraged some developers and financiers to take on risky and unnecessary projects, including miniature versions of Paris and Manhattan.
McKinsey estimates that, excluding the financial sector, almost half of China’s debt is directly or indirectly related to real estate, about $9 trillion. The property market is very diffuse, with more than 89,000 mostly small property developers contributing about 15 percent of the country's GDP growth and accounting for 28 percent of fixed-asset investment.
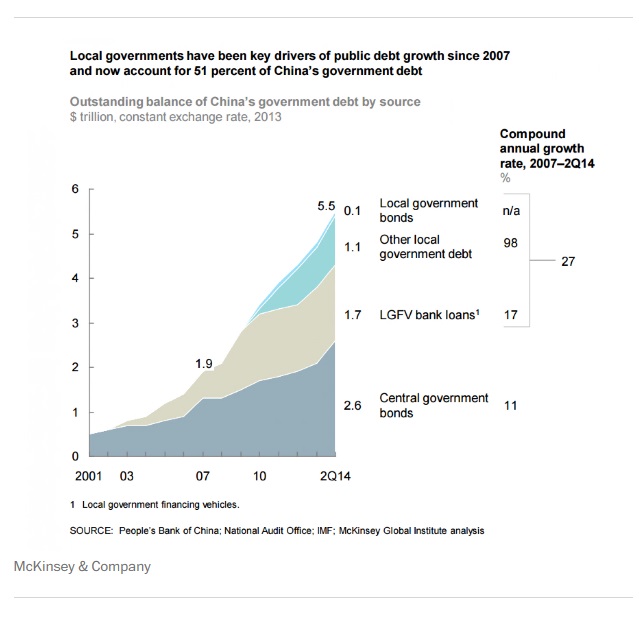
Much of the rest is in the hands of local governments.
China's provinces, cities and counties are actually responsible for racking up a lot of the debt, rather than the federal government. Since 2007, local governments have propped up their growth rates with huge investments. To finance these investments, they turn to something called "local government financing vehicles," or LGFVs. Local governments are technically prohibited from borrowing in China, so they circumvent this restriction by having LGFVs borrow on their behalf.
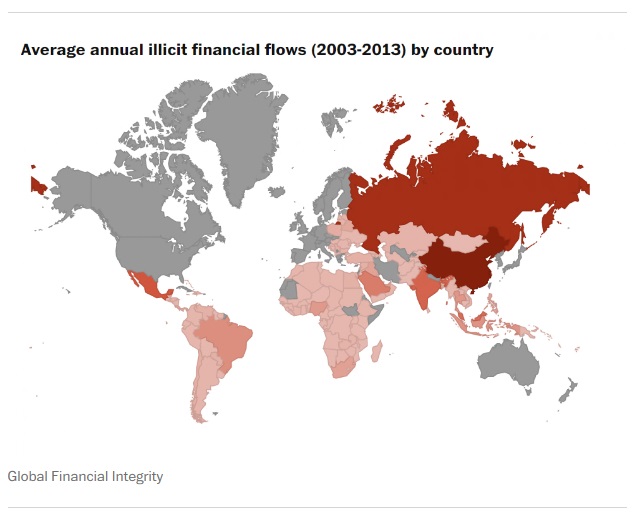
China is the world's most active source of illicit financial flows.
China tops the list as the biggest source of illegal money in the world, followed by India, Mexico and Russia, as the map below by Global Financial Integrity shows. China exported just under $250 billion in illicit financial flows in 2012, which includes laundered funds, drugs, under-the-table payments, and untaxed income.
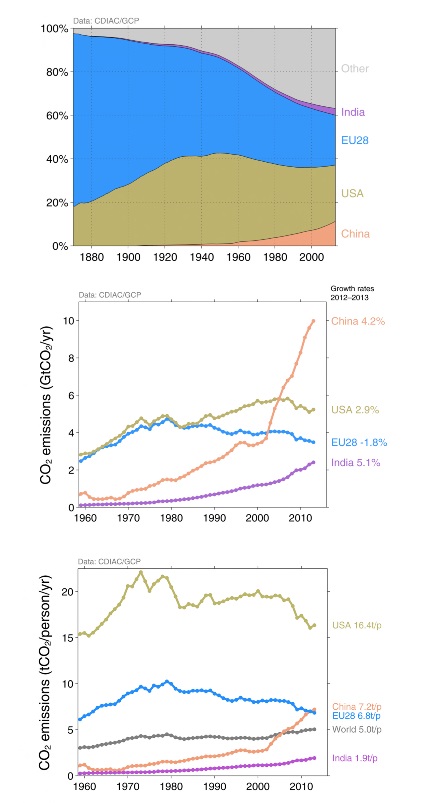
Is the U.S. or China more responsible for global warming? It depends on how you look at it.
These graphs from the Global Carbon Project show different ways of visualizing who is responsible for producing and curbing carbon dioxide emissions.
The first graph, which breaks down total emissions since 1870 by country and continent, highlights the huge historical role of the US and Europe in producing carbon; China is just a tiny blip at the right. The second graph of annual carbon dioxide emissions shows that China surpassed the US as the world’s largest carbon emitter in 2007, and that its emissions are still growing quickly. The last graph offers yet another view: That even though China is now the world’s largest carbon emitter, its per capita emissions are still less than half those of the US.
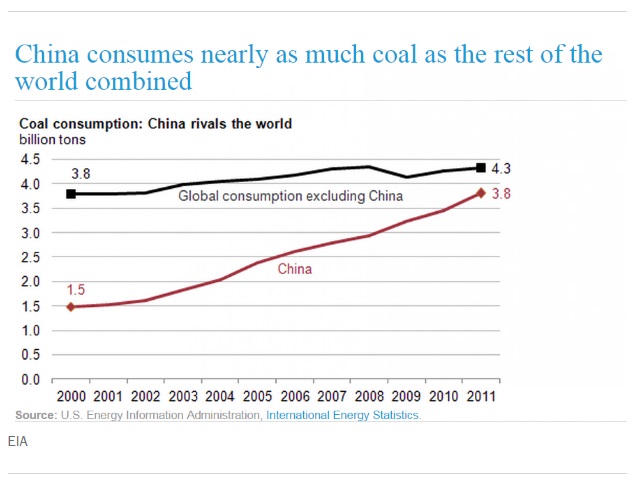
China uses almost as much coal as the rest of the world combined.
If you're wondering why China is such a big producer of carbon, here's one clue. Because the country is relatively rich in coal and poor in other kinds of energy, much of China's economic growth has been fueled by coal. China accounted for about 82 percent of the 2.9 billion tons of global coal demand growth since 2000, according to the U.S. Energy Information Administration, which created the chart below. China now accounts for 47% of global coal consumption—almost as much as the entire rest of the world combined.